


FrAid Library Functions
General Mathematical Constants and Functions
Sampled Functions
Sampled Sound (non-MIDI) Functions
Graphics Functions
| aggregation | cobweb | color3D | consumption | iterFract | julia |
| mandelbrot | newton | orbit | orbit2 | phase | plot |
| plot2 | plot3 | plot3d | plot3f | plotMap | spectrum |
| transform | transform3 |
(undocumented) Prediction Markets Functions
Complex Functions
| abs | acos | acosh | add | asin | asinh |
| atan | atanh | conj | cos | cosec | cosh |
| cot | divide | equal | exp | imag | log |
| multiply | power | real | sec | sin | sinh |
| sqrt | subtract | tan | tanh |
Symbol Table Functions
Utility Functions
| False | True | debug | debugParser | exit | info |
| isComplex | isFunction | isString | loadScript | printClassPath | printDef |
| printDep | printGen | printPlugins | printS | printTree | rename |
| sleep | string | typeOf |
Graphics Helper Functions
E
| Synopsis: |
E; |
| Return Value: |
2.718281828459045 |
| Go to top. |
MaxVal
| Synopsis: |
MaxVal; |
| Description: | the maximum double value (1.7976931348623157E308) |
| Return Value: |
1.7976931348623157E308 |
| Go to top. |
MinVal
| Synopsis: |
MinVal; |
| Description: | the minimum double value (4.9E-324) |
| Return Value: |
4.9E-324 |
| Go to top. |
NaN
| Synopsis: |
NaN; |
| Description: | the Not a Number value - you can return NaN from your FrAid functions when an error happens; |
| Return Value: |
NaN; |
| Go to top. |
NegInf
| Synopsis: |
NegInf; |
| Description: | the negative infinity constant; |
| Return Value: |
- Infinity; |
| Go to top. |
Pi
| Synopsis: |
Pi; |
| Description: | |
| Return Value: |
3.141592653589793 |
| Go to top. |
PosInf
| Synopsis: |
PosInf; |
| Description: | the positive infinity constant; |
| Return Value: |
Infinity; |
| Go to top. |
and
| Synopsis: |
and( Boolean, Boolean ); | Boolean & Boolean; |
| Description: | logical and. This is the actual implementation of the FrAid '&' operator; |
| Return Value: |
Boolean |
| Examples: |
(2 <= 3) & (5 > 1); //(1.0 + 0.0i), same as and(2 <= 3, 5 > 1); |
| Go to top. |
diff
| Synopsis: |
diff(functionToDifferentiate,dimension_to_diff, arg1, ..., argn ); |
| Description: | derivative of a function, the dimensions start from 0 to n-1 |
| Return Value: |
Complex |
| Examples: |
f(x)=diff(sin,0,x); plot(sin,f); diff(sin,0,Pi); |
| Go to top. |
greater
| Synopsis: |
greater( Complex, Complex ); | Complex > Complex; |
| Description: | checks if the first argument is greater than the second one,if the imaginary part of any of the numbers is not zero takes its absolute value. This is the actual implementataion of the FrAid '>' operator. |
| Return Value: |
Boolean |
| Go to top. |
greaterorequal
| Synopsis: |
greaterorequal( Complex, Complex ); | Complex > =Complex; |
| Description: | checks if the first argument is greater or equal to the second one,if the imaginary part of any of the numbers is not zero takes its absolute value. This is the actual implementataion of the FrAid '>=' operator. |
| Return Value: |
Boolean |
| Go to top. |
integer
| Synopsis: |
integer( Complex ); |
| Description: | Returns the integer part of it's argument |
| Return Value: |
Complex |
| Examples: |
integer(2.2); // --> 2 integer(1.99); // --> 1 |
| Go to top. |
isInf
| Synopsis: |
isInf( Complex ); |
| Description: | checks for infinity, returns 1 if any of the real or imaginary parts of the argument are the double infinity |
| Return Value: |
Boolean |
| Examples: |
isInf(PosInf); //(1.0 + 0.0i) |
| Go to top. |
isNaN
| Synopsis: |
isNaN( Complex ); |
| Description: | checks if its argument is NaN |
| Return Value: |
Boolean |
| Go to top. |
isNextIntEven
| Synopsis: |
isNextIntEven( Complex ); |
| Description: | Returns 1 if the next integer number greater than the argument is even, 0 otherwise. |
| Return Value: |
Boolean |
| Examples: |
isNextIntEven( .5 ); // Returns 0 |
| Go to top. |
max
| Synopsis: |
max( Complex [, Complex, Complex, ...] ); |
| Description: | the maximum of a list of numbers |
| Return Value: |
Complex; |
| Go to top. |
min
| Synopsis: |
min( Complex [, Complex, Complex, ...] ); |
| Description: | the minimum of a list of numbers |
| Return Value: |
Complex; |
| Go to top. |
mul
| Synopsis: |
mul( Complex [, Complex, Complex, ...] ); |
| Description: | multiplies a list of numbers |
| Return Value: |
Complex; |
| Go to top. |
negate
| Synopsis: |
negate( Complex ); | -Complex; |
| Description: | unary minus, this is the actual implementataion of the unary FrAid '-' operator; |
| Return Value: |
(-1)*Complex |
| Go to top. |
nextInt
| Synopsis: |
nextInt( Complex ); |
| Description: | Returns the next integer number greater than the argument. |
| Return Value: |
Boolean |
| Examples: |
nextInt( .5 ); // Returns 1 |
| Go to top. |
nextpow2
| Synopsis: |
nextpow2( Complex ); |
| Description: | Returns n - the next power of 2 so 2^n is greater than the argument passed. |
| Return Value: |
Complex |
| Examples: |
nextpow2( 8 ); // --> 3 nextpow2(8.1); // --> 4 |
| Go to top. |
not
| Synopsis: |
negate(Boolean ); | !Boolean; |
| Description: | logical negation of the argument, this is the actual implementataion of the FrAid '!' operator; |
| Return Value: |
Boolaean |
| Go to top. |
notequal
| Synopsis: |
notequal( Complex, Complex ); | Complex != Complex; |
| Description: | checks if the arguments are not equal, this is the actual implementation of the FrAid '!=' operator; |
| Return Value: |
Boolean |
| Go to top. |
or
| Synopsis: |
or(Boolean, Boolean ); Boolean | Boolean; |
| Description: | logical or, this is the actual implementation of the FrAid '|' operator; |
| Return Value: |
Boolean; |
| Go to top. |
quad
| Synopsis: |
quad( Function,Complex, Complex, Complex ); //function, begin, end, number_points |
| Description: | the quadrature of the function from the begin point to the end point (integral) |
| Return Value: |
Complex; |
| Examples: |
quad(sin, -Pi, Pi, 1000);//(-3.3074223103518964E-16 + 0.0i) i.e. 0 |
| Go to top. |
rand
| Synopsis: |
rand( ); |
| Description: | generate a random number |
| Return Value: |
Complex; |
| Examples: |
rand; // --> (0.2457923314228302 + 0.8490886310240474i) |
| Go to top. |
round
| Synopsis: |
round( Complex ); |
| Description: | Rounds (up or down) the real and imaginary parts of its argument. |
| Return Value: |
Complex; |
| Examples: |
round(1.49+1.5i); //--> 1+2i |
| Go to top. |
sign
| Synopsis: |
sign( Complex ); |
| Description: | If the argument is positive will return +1, if the argument is negative will return -1, if the argument is 0 will return 0. |
| Return Value: |
Complex; |
| Examples: |
sign(-2); // --> -1 sign(2); // --> 1 sign(0); // --> 0 |
| Go to top. |
smaller
| Synopsis: |
smaller( Complex, Complex ); | Complex < Complex; |
| Description: | checks if the first argument is smaller than the second one, if the imaginary part of any of the numbers is not zero takes its absolute value. This is the actual implementataion of the FrAid '<' operator. |
| Return Value: |
Boolean |
| Go to top. |
smallerorequal
| Synopsis: |
smallerorequal( Complex, Complex ); | Complex < Complex; |
| Description: | checks if the first argument is smaller or equal to the second one, if the imaginary part of any of the numbers is not zero takes its absolute value. This is the actual implementataion of the FrAid '<=' operator. |
| Return Value: |
Boolean |
| Go to top. |
sum
| Synopsis: |
sum( Complex [, Complex, Complex, ...] ); |
| Description: | sums more than two numbers (add sums only two), sum(a,b,c) is faster than a+b+c (which is add( add( a, b ), c ) ) |
| Return Value: |
Complex; |
| Go to top. |
xor
| Synopsis: |
xor( Boolean, Boolean ); | Boolean # Boolean; |
| Description: | exclusive or, this is the actual implementataion of the FrAid |
| Return Value: |
Boolean |
| Go to top. |
appendS
| Synopsis: |
appendS(SampledFunction1, SampledFunction2); |
| Description: | Appends two vectors (SampledFunctions). Generator Function |
| Return Value: |
SampledFunction |
| Examples: |
f(x)=vector(1,2,3,4);
plot( appendS(f,{-f}) );
|
| Go to top. |
cft
| Synopsis: |
cft(ComplexFunction); |
| Description: | Performs a Fourier Transform of a Continious function. The result is a SampledFunction. Generator Function |
| Return Value: |
SampledFunction |
| Examples: |
b=1; a=1;
controlVar(a,b);
f(x)=a+b*x;
F(x)=cft(f,20);

plot({abs(F)},{atan(real(F)/imag(F))});
plot(f,icft(F));
|
| Go to top. |
cloneS
| Synopsis: |
cloneS(SampledFunction); |
| Description: | Returns a new function identical to the argument but independent from the functions the original depends on (if there are any). Generator Function |
| Return Value: |
SampledFunction |
| Examples: |
a=50; controlVar( a, 30 ); f(x)=sin(2*Pi*a*x); fs(x)=sampleL(f, 0, 1, 1000); //fs depends on any change of f(x) and a fs1(x)=cloneS(fs); //fs1 does not depend on f(x) and a plot(fs,fs1); |
| Go to top. |
conv
| Synopsis: |
conv( SampledFunction1, SampledFunction2 ); |
| Description: | convolution of two vectors |
| Return Value: |
SampledFunction |
| Examples: |
fc(x)=conv(vector(1,2,3,4),vector(4,3,2,1)); printS(fc); |
| Go to top. |
dft
| Synopsis: |
dft( SampledFunction ); |
| Description: | Discrete Fourier Transform (not the Fast!) |
| Return Value: |
SampledFunction (the length of the output is equal of the length of the input) |
| Examples: |
printS(dft(vector(1,2,3,4))); |
| Go to top. |
dft1
| Synopsis: |
dft1( SampledFunction ); |
| Description: | Discrete Fourier Transform (not the Fast!) |
| Return Value: |
SampledFunction (the length of the output is half + 1 the length of the input) |
| Examples: |
printS(dft1(vector(1,2,3,4))); |
| Go to top. |
elemS
| Synopsis: |
elemS( SampledFunction, Complex1 ); //with two args returns the value of the SampledFunction at index Complex1 elemS( SampledFunction, Complex1, Complex1 ); //with three args changes the value of elem. with number Complex1 to Complex2 |
| Description: | Query or change the value of elem. number Complex1. |
| Return Value: |
The (old) value of elem # Complex1. |
| Examples: |
f(x)=vector(1,1,1); a=elemS(f,0); a; // --> 1 elemS(f,0,2); a; // --> 2 f(x)=vector(3,3,3); a; // --> 3 |
| Go to top. |
fft
| Synopsis: |
fft( SampledFunction ); |
| Description: | Fast Fourier Transform |
| Return Value: |
SampledFunction (the length of the output is equal of the length of the input) |
| Examples: |
printS(fft(vector(1,2,3,4))); |
| Go to top. |
fft1
| Synopsis: |
fft1( SampledFunction ); |
| Description: | Discrete Fourier Transform (not the Fast!) |
| Return Value: |
SampledFunction (the length of the output is half + 1 the length of the input) |
| Examples: |
printS(fft1(vector(1,2,3,4))); |
| Go to top. |
firResp
| Synopsis: |
firResp( SampledFunction ); |
| Description: | Frequency response of a FIR filter (as described in Hamming's book) |
| Return Value: |
ComplexFunction |
| Examples: |
f(x)=1; fs(x)=sampleL(f,0,1,30); //create a vector end=2; controlVar(end); fst(x)=truncateS(fs,0,end); //get control of the vector's length fl(x)=fst(x)/lengthS(fst); //make the sum of the elements allways be 1 plot(fl); flr(x)=firResp(fl); //create a function which will follow the freq. response plot(flr,-.1,1.1,Pi+.1,-.5); db(x)=8.685890*log(flr(x)); //show in dB plot(db,-.1,1.1,Pi+.1,-30); |
| Go to top. |
histogramS
| Synopsis: |
histogramS( SampledFunction, Complex1 ); |
| Description: | Histogram of the input vector with number of levels passed as second parameter. |
| Return Value: |
SampledFunction with Complex1 number of elements representing the histogram of the input vector. |
| Examples: |
sf=10000; f(x)=recordSound(sf,2048); plot(f); plot( histogramS( f, 19 ) ); |
| Go to top. |
icft
| Synopsis: |
icft(SampledFunction); |
| Description: | Performs a Inverse Fourier Transform of a Sampled function. The result is a ComplexFunction. Generator Function |
| Return Value: |
ComplexFunction |
| Examples: |
b=1; a=1;
controlVar(a,b);
f(x)=a+b*x;
F(x)=cft(f,20);

plot({abs(F)},{atan(real(F)/imag(F))}); //plot the power and phase
plot(f,icft(F));
|
| Go to top. |
idft
| Synopsis: |
idft( SampledFunction ); |
| Description: | Inverse Discrete Fourier Transform. The length of the output is equal of the length of the input. |
| Return Value: |
SampledFunction |
| Examples: |
printS(idft(dft(vector(1,2,3,4)))); |
| Go to top. |
idft1
| Synopsis: |
idft1( SampledFunction ); |
| Description: | Inverse Discrete Fourier Transform. The length of the output is (len(input)+1)*2. |
| Return Value: |
SampledFunction |
| Examples: |
printS(idft1(dft1(vector(1,2,3,4)))); |
| Go to top. |
ifft
| Synopsis: |
ifft( SampledFunction ); |
| Description: | Inverse Discrete Fourier Transform. The length of the output is equal of the length of the input. |
| Return Value: |
SampledFunction |
| Examples: |
printS(ifft(fft(vector(1,2,3,4)))); |
| Go to top. |
ifft1
| Synopsis: |
ifft1( SampledFunction ); |
| Description: | Inverse Discrete Fourier Transform. The length of the output is (len(input)+1)*2. |
| Return Value: |
SampledFunction |
| Examples: |
printS(ifft1(fft1(vector(1,2,3,4)))); |
| Go to top. |
inverseFilter
| Synopsis: |
inverseFilter( SampledFunction ); |
| Description: | Inverses the filter passed as argument. The frequency response of the resulting filter is flipped vertically. |
| Return Value: |
SampledFunction |
| Examples: |
samplingF = 2048; //Hz samplingTime = 1; //seconds filterLength = 81; //points shape(x) = if x < ( samplingF / 2 ) / 3 then 1 else 0; //say limit to a third of the interval fr(x)=sampleN( shape, 0, 1, samplingF/2+1 ); //freq. response //plot(fr); fk(x)=ifft1(fr); //filter kernel 1 //plot(fk); fkshr(x)=shrotS(fk,filterLength/2); fktr(x)=truncateS(fkshr,0,filterLength-1); fkn(x)=fktr(x)/sumS(fktr); //normalized kernel blackmanW(x,filterLength) = 0.42 - 0.5 * cos( 2 * Pi * x / filterLength ) + 0.08 * cos( 4 * Pi * x / filterLength ); //Blackman wfk(x)=blackmanW(x/stepS(fkn),filterLength)*fkn(x); //the Blackman windowed filter fkInv(x)=inverseFilter(wfk); //inverse //fkInv(x)=reverseFilter(wfk); //reverse plot(wfk,fkInv); //check the resulting filters frequency response efr(x)=firResp(wfk); //estimated freq. response efrInv(x)=firResp(fkInv); //estimated freq. response length 2 plot(efr,efrInv,-.1,1.1,Pi+.1,-.5); |
| Go to top. |
lengthS
| Synopsis: |
lengthS( SampledFunction ); |
| Description: | The length of the vector (SampledFunction) passed as argument. |
| Return Value: |
Complex |
| Examples: |
lengthS(vector(1,2,3,4)); // --> 4 |
| Go to top. |
loadS
| Synopsis: |
loadS( FileName, Start, Step ); |
| Description: | Parses a text file with numbers and creates a SampledFunction. |
| Return Value: |
SampledFunction |
| Examples: |
f(x)=loadSound("/home/iii/iii123.wav");
plot(f);
playSound(f);
saveS(f,"/home/iii/iii.ttt");
g(x)=loadS("/home/iii/iii.ttt",startS(f),stepS(f));
plot(g);
|
| See also: | saveS |
| Go to top. |
maxS
| Synopsis: |
maxS( SampledFunction ); |
| Description: | Returns the maximum element of a SampledFunction. |
| Return Value: |
Complex |
| Examples: |
maxS(vector(1,2,3,4)); // --> 4 |
| Go to top. |
minS
| Synopsis: |
minS( SampledFunction ); |
| Description: | Returns the minimum element of a SampledFunction. |
| Return Value: |
Complex |
| Examples: |
minS(vector(1,2,3,4)); // --> 4 |
| Go to top. |
mulS
| Synopsis: |
mulS( SampledFunction, SampledFunction ); |
| Description: | Returns the vector direct product (dyadic) of the input parameters. |
| Return Value: |
Complex |
| Examples: |
mulS(vector(1,2,3,4),vector(4,3,2,1)); // --> 20 |
| Go to top. |
padS
| Synopsis: |
padS( SampledFunction, NewLength ); padS( SampledFunction, NewLength, PadValue); |
| Description: | Returns the input SampledFunction padded to the new length with 0 (the two argument version) or with a new PadValue (the three argument version). |
| Return Value: |
SampledFunction |
| Examples: |
printS(padS(vector(1,2,3,4),6,Pi)); printS(padS(vector(1,2,3,4),6)); |
| Go to top. |
randS
| Synopsis: |
randS( StartValue, StepValue, Length ); |
| Description: | Returns a SampledFunction with the provided StartValue, StepValue, Length and initialized with random Complex values. |
| Return Value: |
SampledFunction |
| Examples: |
printS(randS(0,1,5)); |
| Go to top. |
reverseFilter
| Synopsis: |
reverseFilter( SampledFunction ); |
| Description: | Reverses the filter passed as argument. The frequency response of the resulting filter is flipped horizontally. |
| Return Value: |
SampledFunction |
| Examples: |
samplingF = 2048; //Hz samplingTime = 1; //seconds filterLength = 81; //points shape(x) = if x < ( samplingF / 2 ) / 3 then 1 else 0; //say limit to a third of the interval fr(x)=sampleN( shape, 0, 1, samplingF/2+1 ); //freq. response //plot(fr); fk(x)=ifft1(fr); //filter kernel 1 //plot(fk); fkshr(x)=shrotS(fk,filterLength/2); fktr(x)=truncateS(fkshr,0,filterLength-1); fkn(x)=fktr(x)/sumS(fktr); //normalized kernel blackmanW(x,filterLength) = 0.42 - 0.5 * cos( 2 * Pi * x / filterLength ) + 0.08 * cos( 4 * Pi * x / filterLength ); //Blackman wfk(x)=blackmanW(x/stepS(fkn),filterLength)*fkn(x); //the Blackman windowed filter //fkInv(x)=inverseFilter(wfk); //inverse fkInv(x)=reverseFilter(wfk); //reverse plot(wfk,fkInv); //check the resulting filters frequency response efr(x)=firResp(wfk); //estimated freq. response efrInv(x)=firResp(fkInv); //estimated freq. response length 2 plot(efr,efrInv,-.1,1.1,Pi+.1,-.5); |
| Go to top. |
rk
| Synopsis: |
rk( Function1, ..., FunctionN, //the system
    Complex1, ..., ComplexN,   //the initial conditions
    Complex, Complex, Complex, //the time constraints - start point, end point, number fo samples
    String );                  //prefix of the function names to be registered/returned (see the example bellow)
|
| Description: | registers N one argument functions named _rk_0(x), _rk_1(x), ... _rk_{N-1}(x) in the symbol table; they are not treated as UserDefinedFunctions if the number of samples is too big (for a high resolution plot it may take 10,000 and more), the printDef() function may not function properly; |
| Return Value: |
- how many functions were successfully registered in the symbol table, should be N |
| Examples: |
sigma = 10;
b = 8/3;
r = 28;
t0 = 0;
tn = 100;
steps = 10000;
lor1( x1, x2, x3, t ) = sigma * (x2 - x1);
lor2( x1, x2, x3, t ) = r*x1 - x2 - x1*x3;
lor3( x1, x2, x3, t ) = x1*x2 - b*x3;
rk(    lor1,//the system
       lor2,
       lor3,
       0, 1, 0,                //the initial condition
       t0,                     //the start point
       tn,                     //the end point
       steps,                  //number of samples
       "_rk"                   //prefix of the return function names
                               //in this case _rk_0, _rk_1 and _rk_2
                               //will be registered
);
plot2(_rk_0,_rk_2,t0,tn);
|
| Go to top. |
rk1
| Synopsis: |
rk1( Function1, ..., FunctionN, //the system
    FunctionN+1, ..., Function2N,   //the initial conditions
    Function2N+1, Function2N+2, Function2N+3, //the time constraints - start point, end point, number fo samples
    String );                  //prefix of the function names to be registered/returned (see the example bellow)
|
| Description: | This is a variation of rk() which takes function references for arguments and listens for changes |
| Return Value: |
- how many functions were successfully registered in the symbol table, should be N |
| Examples: | |
| See also: | rk |
| Go to top. |
sampleL
| Synopsis: |
sampleL( ComplexFunction, StartPoint, EndPoint, NumberOfSamples ); |
| Description: | Samples the given Complex. |
| Return Value: |
SampledFunction |
| Examples: |
a=50;
controlVar( a, 30 );
f(x)=0.7*sin(2*Pi*a*x) + sin(2*Pi*120*x); //compose a signal
fs(x)=sampleL(f, 0, 1, 1000);
F(x)=dft1(fs);
plot({abs(F)},{atan( real(F) / imag(F))});
plot(fs,idft1(F));
|
| Go to top. |
sampleN
| Synopsis: |
sampleN( ComplexFunction, StartPoint, Step, NumberOfSamples ); |
| Description: | Samples the given Complex. |
| Return Value: |
SampledFunction |
| Examples: |
a=50; controlVar( a, 30 ); f(x)=0.7*sin(2*Pi*a*x) + sin(2*Pi*120*x); fs(x)=sampleL(f, 0, 1, 1000); fr(x)=sampleN(f, 0, 1/1000, 1000); plot(fs,fr); |
| Go to top. |
samples
| Synopsis: |
samples( StartValue, Step, Value1, Value2, ... ); |
| Description: | Creates a SampledFunction with StartValue, Step and values supplied as parameters Value1, Value2, etc... |
| Return Value: |
SampledFunction |
| Examples: |
f(x)=samples(2,2,0,1,0,1,0,1,0); plot(sampleL(f,startS(f),startS(f)+stepS(f)*lengthS(f), 100)); |
| See also: | vector |
| Go to top. |
saveS
| Synopsis: |
saveS( SampledFunction, FileName ); |
| Description: | Converts a SampledFunction to a character string of comma separated numbers and saves it to FileName. |
| Return Value: |
0 |
| Examples: |
f(x)=saveSound("/home/iii/iii123.wav");
plot(f);
playSound(f);
saveS(f,"/home/iii/iii.ttt");
g(x)=loadS("/home/iii/iii.ttt",startS(f),stepS(f));
plot(g);
|
| See also: | loadS |
| Go to top. |
shrotS
| Synopsis: |
shrotS( SampledFunction, numberToShiftRotate ); |
| Description: | Shift-rotate the given SampledFunction by numberToShiftRotate |
| Return Value: |
SampledFunction |
| Examples: |
printS(shrotS(vector(1,2,3,4), 2)); // --> 3,4,1,2 |
| Go to top. |
startS
| Synopsis: |
startS( SampledFunction ); startS( SampledFunction, newStartValue ); |
| Description: | Returns the start value of the given SampledFunction. If called with three args changes the start value. |
| Return Value: |
Complex |
| Examples: |
startS(samples(6,5,4,3,2,1)); // --> 6 |
| Go to top. |
stepS
| Synopsis: |
stepS( SampledFunction ); stepS( SampledFunction, newStepValue ); |
| Description: | Returns the step value of the given SampledFunction. If called with three args changes the step value. |
| Return Value: |
Complex |
| Examples: |
stepS(samples(6,5,4,3,2,1)); // --> 5 |
| Go to top. |
sumS
| Synopsis: |
sumS( SampledFunction ); |
| Description: | Sums the elements of the given SampledFunction. |
| Return Value: |
Complex |
| Examples: |
sumS(vector(1,2,3,4)); // --> 10 |
| Go to top. |
truncateS
| Synopsis: |
truncateS( SampledFunction, startIndex, endIndex ); |
| Description: | Truncate the passed SampledFunction from startIndex (0 based) to endIndex inclusive. |
| Return Value: |
SampledFunction |
| Examples: |
printS(truncateS(vector(1,2,3,4),0,2)); // --> 1,2,3 |
| Go to top. |
vector
| Synopsis: |
vector( Value1, Value2, ... ); |
| Description: | Creates a SampledFunction with StartValue=0, Step=1 and values supplied as parameters Value1, Value2, etc... |
| Return Value: |
SampledFunction |
| Examples: |
f(x)=vector(0,1,0,1,0,1,0); plot(sampleL(f,startS(f),startS(f)+stepS(f)*lengthS(f), 100)); |
| See also: | samples |
| Go to top. |
loadSound
| Synopsis: |
loadSound( fileName ); |
| Description: | Loads an audio file (of type supported by your JRM) to a SampledFunction |
| Return Value: |
SampledFunction |
| Examples: |
plot(loadSound("/home/iii/iii123.wav"));
|
| Go to top. |
playSound
| Synopsis: |
playSound( SampledFunction ); |
| Description: | Play a SampledFunction through the sound card. Opens a play controller. |
| Return Value: |
0 |
| Examples: |
playSound( loadSound("/home/iii/iii123.wav") );
|
| Go to top. |
recordSound
| Synopsis: |
recordSound( SamplingFrequency, bufferSize ); |
| Description: | Opens a record sound controller and starts listening for input from the sound card. |
| Return Value: |
SampledFunction |
| Examples: |
sf=10000;
f(x)=recordSound(sf);
plot(f,0,.01,1,-.01);
plot({abs(fft1(f))});
|
| Go to top. |
saveAsSound
| Synopsis: |
saveAsSound( SampledFunction, fileName ); |
| Description: | Save the given SampledFunction to an audio file. |
| Return Value: |
0 |
| Examples: |
f(x)=loadSound("/home/iii/iii123.wav");
saveAsSound( f, "/home/iii/iii123_test.wav" );
|
| Go to top. |
aggregation
| Synopsis: |
aggregation( [Complex*,] /*optional window number*/); |
||||||||||
| Description: | |||||||||||
| Return Value: |
Complex - the window number |
||||||||||
| Plugin Features |
|
||||||||||
| Examples: |
aggregation(); |
||||||||||
| Go to top. |
cobweb
| Synopsis: |
cobweb( [Complex*,]                //optional window number
        [Function*,...]              //list of functions
        [Complex, Complex, Complex, Complex]  //optional upper left and bottom right 2D plane corner coordinates
        [Complex, Complex]); //optional window size (width, height)
|
||||||||||||||
| Description: | plots a cobweb diagram | ||||||||||||||
| Return Value: |
Complex - the window number |
||||||||||||||
| Plugin Features |
|
||||||||||||||
| Examples: |
f(x)=3.75*x*(1-x); cobweb(f); |
||||||||||||||
| Images: |  |
||||||||||||||
| See also: | _plot | ||||||||||||||
| Go to top. |
color3D
| Synopsis: |
color3D( [Complex*,] /*optional window number*/
         Function* ); //the function to plot
|
||||||||||
| Description: | plots a diagram with the assigned colors of the 2 argument function passed | ||||||||||
| Return Value: |
Complex - the window number |
||||||||||
| Plugin Features |
|
||||||||||
| Examples: |
        f(x,y) = x*y;
        color3D(f);
|
||||||||||
| Go to top. |
consumption
| Synopsis: | |
| Description: | Experimental function... |
| Return Value: | |
| Go to top. |
iterFract
| Synopsis: |
iterFract( [Complex*,]                //optional window number
           Function*, Complex*, //first     function and xOffset of the first transform
           Function*, Complex*, //second function and yOffset of the first transform
           [Function*, Complex*, //first     function and xOffset of the next transform
           Function*, Complex*, //second function and yOffset of the next transform
           ...]);
|
||||||||||||||
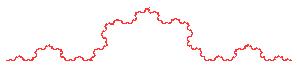
| Description: | [iterativeFractals] iterates a set of contracting transformations iter fract | ||||||||||||||
| Return Value: |
Complex - the window number; |
||||||||||||||
| Plugin Features |
|
||||||||||||||
| Examples: |
        To plot the image on the top start with:

            ff(r,a,off,x,y)=r*cos(a)*x - r*sin(a)*y + off; //the generic transformation
            gg(r,a,off,x,y)=r*sin(a)*x + r*cos(a)*y + off;

            r1=.5; //the parameters I want to control for the first transform
            a1=Pi/4;
            xOff1=0;
            yOff1=0;
            controlVar(r1, a1,xOff1, yOff1 ); //variable controller

            f1(x,y)=ff(r1,a1,0,x,y); //the first transform
            g1(x,y)=gg(r1,a1,0,x,y);

            r2=.5; //the parameters I want to control for the first transform
            a2=-Pi/3;
            xOff2=0;
            yOff2=0;
            controlVar(r2,a2,xOff2,yOff2); //variable controller

            f2(x,y)=ff(r2,a2,0,x,y); //the second transform
            g2(x,y)=gg(r2,a2,0,x,y);

            iterFract(  f1,xOff1, //first
                        g1,yOff1,
                        f2,xOff2,  //second
                        g2,yOff2 );

         draw the blue  figure,

             iter initial

        click Step from the popup and with the sliders adjust the two green transformed  images
        now if you start iterating (using Step or Iterate from the popup ) you'll get the attractor of the system;

        A three transforms plot and starting with a single line can give you:

            little tree  or little tree 2

            or  starting with a triangle and changing the replaceLast setting to false
            (note what happens when you change the parameters; use the sliders)
|
||||||||||||||
| Images: |  , ,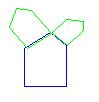 , - begin with this; , - begin with this;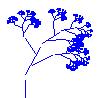 , ,
 , , , ,
 , ,
 , , |
||||||||||||||
| See also: | transform | ||||||||||||||
| Go to top. |
julia
| Synopsis: |
julia( [Complex*,]           //optional window number
       [Function*,...]       //list of functions
       [Complex, Complex, Complex, Complex]  //optional upper left and bottom right 2D plane corner coordinates
       [Complex, Complex]); //optional window size (width, height)
|
||||||||||||||
| Description: | given a complex function plots a julia fractal julia1 in any number of colors julia it is generally quite slow, start with a small window, adjust the colors and iteration numbers and when you get the desired look, go large; | ||||||||||||||
| Return Value: |
Complex - the window number; |
||||||||||||||
| Plugin Features |
|
||||||||||||||
| Examples: |
        c=-0.122+0.745i;
        f(z)=z^2+c;
        julia(f);
|
||||||||||||||
| Images: |  , , , , |
||||||||||||||
| See also: | _plot | ||||||||||||||
| Go to top. |
mandelbrot
| Synopsis: | |||||||||||||||
| Description: | plots the specified functions (undocumented) | ||||||||||||||
| Return Value: |
Complex - the window number where the functions were plot; |
||||||||||||||
| Plugin Features |
|
||||||||||||||
| Examples: |
clear(); a=2; controlVar(a); f(z,c)=z^a+c; mandelbrot( f ); |
||||||||||||||
| See also: | julia | ||||||||||||||
| Go to top. |
newton
| Synopsis: | |
| Description: | Experimental function... When finished should plot the fractal associated with Newton's method |
| Return Value: | |
| Go to top. |
orbit
| Synopsis: |
orbit( [Complex*,]          //optional window number
       [Function*,...]      //list of functions
       [Complex, Complex, Complex, Complex]  //optional upper left and bottom right 2D plane corner coordinates
       [Complex, Complex]); //optional window size (width, height)
|
||||||||||||||
| Description: | plots a orbit diagram orbit, takes a two argument function, the first is a variable (oordinate), the second is a parameter (abscissa) |
||||||||||||||
| Return Value: |
Complex - the window number; |
||||||||||||||
| Plugin Features |
|
||||||||||||||
| Examples: |
        f(x,r)=r*x*(1-x);
        orbit(f);

        will generate the image on the first line of this section.

        Or the following script will generate the image on the right:       orbit2

        f(x,p)= if x < 0 then 0 else
                if (x >= 0) & (x < 1/2) then p*x else
                if (x >= 1/2) & (x < 1) then -p*x+p else 0;
        orbit(f);
|
||||||||||||||
| Images: |  , ,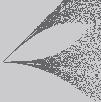 |
||||||||||||||
| See also: | _plot | ||||||||||||||
| Go to top. |
orbit2
| Synopsis: |
orbit2( [Complex*,]          //optional window number
       XFunction, YFunction      //list of functions
       [Complex, Complex, Complex, Complex]  //optional upper left and bottom right 2D plane corner coordinates
       [Complex, Complex]); //optional window size (width, height)
|
||||||||||||||
| Description: | plots a orbit2 diagram | ||||||||||||||
| Return Value: |
Complex - the window number; |
||||||||||||||
| Plugin Features |
|
||||||||||||||
| Examples: |
fx( x, y ) = 1 - y + abs( x ); fy( x, y ) = x; orbit2( fx, fy ); |
||||||||||||||
| Go to top. |
phase
| Synopsis: |
phase( [Complex*,] //optional window number [Function*,...] //list of functions [Complex, Complex, Complex, Complex] //optional upper left and bottom right 2D plane corner coordinates [Complex, Complex]); //optional window size (width, height) |
||||||||||||||||
| Description: | plots the vector field and phase diagram for a given second order differential equation phase even if your equation is homogenious you need to have an independent variable in the argument list | ||||||||||||||||
| Return Value: |
Complex - the window number; |
||||||||||||||||
| Plugin Features |
|
||||||||||||||||
| Examples: |
        f(x,y,t)= x - y;
        g(x,y,t)= 1 - x^2;
        phase( f, g );
|
||||||||||||||||
| Images: |  |
||||||||||||||||
| Go to top. |
plot
| Synopsis: |
plot( [Complex*,]          //optional window number
      [Function*,...]      //list of functions
      [Complex, Complex, Complex, Complex]  //optional upper left and bottom right 2D plane corner coordinates
      [Complex, Complex]); //optional window size (width, height)
|
||||||||||||||
| Description: | plots the specified functions plot | ||||||||||||||
| Return Value: |
Complex - the window number where the functions were plot; |
||||||||||||||
| Plugin Features |
|
||||||||||||||
| Examples: |
        f(x)=sin(2*x)+sin(3*x);
        plot(g),log);
|
||||||||||||||
| Images: |  |
||||||||||||||
| Go to top. |
plot2
| Synopsis: |
plot2( [Complex*,]                     //optional window number
       Function*,Function* ,           //the two functions
       Complex, Complex,               //the start and end points of the independant variable
       [Complex, Complex, Complex, Complex]  //optional upper left and bottom right 2D plane corner coordinates
       [Complex, Complex]);           //optional window size (width, height)
|
||||||||||||||
| Description: | plots two functions relative to each other plot2 | ||||||||||||||
| Return Value: |
Complex - the window number; |
||||||||||||||
| Plugin Features |
|
||||||||||||||
| Examples: |
        f(x)=sin(2*x)+sin(3*x);
        plot2( sin, f,0 ,2*Pi );
|
||||||||||||||
| Images: |  |
||||||||||||||
| Go to top. |
plot3
| Synopsis: | |||||||||||||||
| Description: | plots the specified functions (undocumented) | ||||||||||||||
| Return Value: |
Complex - the window number where the functions were plot; |
||||||||||||||
| Plugin Features |
|
||||||||||||||
| Examples: |
- see the demo on fraid.org |
||||||||||||||
| Go to top. |
plot3d
| Synopsis: | |||||||||||||||
| Description: | plots the specified functions (undocumented) | ||||||||||||||
| Return Value: |
Complex - the window number where the functions were plot; |
||||||||||||||
| Plugin Features |
|
||||||||||||||
| Examples: |
- see the demo on fraid.org |
||||||||||||||
| Go to top. |
plot3f
| Synopsis: | |||||||||||||||
| Description: | plots the specified functions (undocumented) | ||||||||||||||
| Return Value: |
Complex - the window number where the functions were plot; |
||||||||||||||
| Plugin Features |
|
||||||||||||||
| Examples: |
see the demo on fraid.org |
||||||||||||||
| Go to top. |
plotMap
| Synopsis: |
plotMap([Complex*,] //optional window number [Function*,...] //list of functions [Complex, Complex, Complex, Complex] //optional upper left and bottom right 2D plane corner coordinates [Complex, Complex]); //optional window size (width, height) |
||||||||||||||
| Description: | plots the development in time of an iterative map plotmap | ||||||||||||||
| Return Value: |
Complex - the window number where the functions were plot; |
||||||||||||||
| Plugin Features |
|
||||||||||||||
| Examples: |
g(x)=3.95*x*(1-x); plotMap(g); |
||||||||||||||
| Images: |  |
||||||||||||||
| Go to top. |
spectrum
| Synopsis: |
spectrum( SampledFunction, length ); |
| Description: | Discrete Fourier Transform (not the Fast!) |
| Return Value: |
Plots the spectrum of a SampledFunction. The abscissa is time, the ordinate is frequency. The amplitude for each frequency at any moment of time is color coded according to the plot settings (right click->Settings->plotColors). |
| Examples: |
sf=10000; f(x)=recordSound(sf); plot(f,0,.01,1,-.01); a=spectrum(f,512); plotOption(a,"threshold",.1); |
| Go to top. |
transform
| Synopsis: |
transform([Complex*,]          //optional window number
          Function*, Function* //the transform, linear or not
          [Complex, Complex, Complex, Complex]  //optional upper left and bottom right 2D plane corner coordinates
          [Complex, Complex]); //optional window size (width, height)
|
||||||||||||||
| Description: | will transfrom a mouse entered 2D image transform; Takes two, two argument functions. You can animate your transformations by setting the iterate and delay_ms settings: animate |
||||||||||||||
| Return Value: |
Complex - the window number where the functions were plot; |
||||||||||||||
| Plugin Features |
|
||||||||||||||
| Examples: |
ff(r,s,a,b,off,x,y)=r*cos(a)*x - s*sin(b)*y + off; //first transform equation gg(r,s,a,b,off,x,y)=r*sin(a)*x - s*cos(b)*y + off; //second transform equation r1=1; //x scaling s1=1; //y scaling a1=Pi/4; //first angle b1=3*Pi/4; //second angle xOff1=0.05; //x offset yOff1=0; //y offset controlVar(a1, b1,xOff1, yOff1, r1, s1 ); //GUI control for the variables f1(x,y)=ff(r1,s1,a1,b1,xOff1,x,y); g1(x,y)=gg(r1,s1,a1,b1,yOff1,x,y); transform(f1,g1); |
||||||||||||||
| Images: |  , , |
||||||||||||||
| See also: | iterFract | ||||||||||||||
| Go to top. |
transform3
| Synopsis: | |||||||||||||||
| Description: | plots the specified functions (undocumented) | ||||||||||||||
| Return Value: |
Complex - the window number where the functions were plot; |
||||||||||||||
| Plugin Features |
|
||||||||||||||
| Examples: |
see the demo on fraid.org |
||||||||||||||
| Go to top. |
pmChart
| Synopsis: | |
| Description: | Experimental function... |
| Return Value: | |
| Go to top. |
predictionMarket
| Synopsis: | |
| Description: | Experimental function... |
| Return Value: | |
| Go to top. |
abs
| Synopsis: |
abs( Complex ); |
| Description: | returns the absolute value of it's argument; |
| Return Value: |
Complex, imaginary part = 0; |
| Examples: |
         abs(3+6i);  // (6.708203932499369 + 0.0i)
         abs(-2);      // (2.0 + 0.0i)
|
| Go to top. |
acos
| Synopsis: |
acos(Complex); |
| Description: | arccos |
| Return Value: |
Complex |
| Examples: | |
| Go to top. |
acosh
| Synopsis: |
acosh( Complex ); |
| Description: | hyperbolic arccos |
| Return Value: |
Complex |
| Examples: | |
| Go to top. |
add
| Synopsis: |
add(Complex , Complex ); |
| Description: | this is the actual implenetation of the FrAid '+' operator. |
| Return Value: |
Complex |
| Examples: |
add(3+4i,5+6i); // (8.0 + 10.0i), same as 3+4i + 5+6i
|
| Go to top. |
asin
| Synopsis: |
asin( Complex ); |
| Description: | arcsine |
| Return Value: |
Complex |
| Go to top. |
asinh
| Synopsis: |
asinh( Complex ); |
| Description: | hyperbolic arcsine |
| Return Value: |
Complex |
| Go to top. |
atan
| Synopsis: |
atan(Complex) |
| Description: | arctangens |
| Return Value: |
Complex |
| Go to top. |
atanh
| Synopsis: |
atanh( Complex ); |
| Description: | hyperbolic arctangens |
| Return Value: |
Complex |
| Go to top. |
conj
| Synopsis: |
conj( Complex ); |
| Description: | returns the complex conjugate of its argument; |
| Return Value: |
Complex |
| Examples: |
conj(3+4i); //(3.0 - 4.0i) conj(3-4i); //(3.0 + 4.0i) |
| Go to top. |
cos
| Synopsis: |
cos( Complex ); |
| Description: | cosine |
| Return Value: |
Complex |
| Go to top. |
cosec
| Synopsis: |
cosec( Complex ); |
| Description: | cosecant |
| Return Value: |
Complex |
| Go to top. |
cosh
| Synopsis: |
cosh( Complex ); |
| Description: | hyperbolic cosine |
| Return Value: |
Complex |
| Go to top. |
cot
| Synopsis: |
cot( Complex ); |
| Description: | cotangent |
| Return Value: |
Complex |
| Go to top. |
divide
| Synopsis: |
divide( Complex, Complex ); | Complex / Complex; |
| Description: | division function, this is the actual implementation of the FrAid '/' operator; |
| Return Value: |
Complex |
| Go to top. |
equal
| Synopsis: |
equal( Complex | String, Complex | String ); | Complex | String == Complex | String; |
| Description: | checks if its arguments for equality, works for both Complex and String, this is the actual implementation of the FrAid '==' operator; |
| Return Value: |
1 if equal else 0 |
| Examples: |
"Hi"=="Hi"; //1 "Hi"=="Hi."; //0 equal( "Hi", "Hi" ); //1 equal( "Hi", "Hi." ); //0 equal( "Hi", 7 ); //0 |
| Go to top. |
exp
| Synopsis: |
exp( Complex ); |
| Return Value: |
Complex |
| Go to top. |
imag
| Synopsis: |
imag( Complex ) |
| Description: | the imaginary part of its argument |
| Return Value: |
Complex, with imaginary part 0; |
| Go to top. |
log
| Synopsis: |
log( Complex ); |
| Description: | logarithm |
| Return Value: |
Complex |
| Go to top. |
multiply
| Synopsis: |
multiply( Complex, Complex ); | Complex * Complex; |
| Description: | multilies its arguments, this is the actual implementation of the FrAid '*' operator; |
| Return Value: |
Complex |
| Go to top. |
power
| Synopsis: |
power( Complex, Complex ); | Complex^Complex; |
| Description: | the first argument power the second one, this is the actual implementation of the FrAid '^' operator; |
| Return Value: |
Complex |
| Go to top. |
real
| Synopsis: |
real( Complex ); |
| Description: | the real part of a Complex number |
| Return Value: |
Complex, the imaginary part will be zero; |
| Go to top. |
sec
| Synopsis: |
sec( Complex ); |
| Description: | secant; |
| Return Value: |
Complex; |
| Go to top. |
sin
| Synopsis: |
sin( Complex ); |
| Description: | sine function; |
| Return Value: |
Complex |
| Go to top. |
sinh
| Synopsis: |
sinh( Complex ); |
| Description: | hyperbolic sine; |
| Return Value: |
Complex |
| Go to top. |
sqrt
| Synopsis: |
sqrt( Complex ); |
| Description: | square root |
| Return Value: |
Complex; |
| Go to top. |
subtract
| Synopsis: |
subtract( Complex, Complex); | Complex - Complex; |
| Description: | subtracts the second argument from the first one, this is the actual implementataion of the FrAid '-' operator; |
| Return Value: |
Complex |
| Go to top. |
tan
| Synopsis: |
tan( Complex ); |
| Description: | tangent; |
| Return Value: |
Complex |
| Go to top. |
tanh
| Synopsis: |
tanh( Complex ); |
| Description: | hyperbolic tangent; |
| Return Value: |
Complex |
| Go to top. |
assign
| Synopsis: |
assign( UserDefinedVariable*, Complex* ); |
| Description: | Assigns a complex value to the specified no argument function. Use in FrAid defined functions (see example). As a side effect lets you animate your graphics. |
| Return Value: |
the value assigned - Complex |
| Examples: |
A very basic example:
      a=5;
      assign(a, 3); //same as just a = 3;
      a;
      assign(a, sin(Pi/3));
      a;

A more meaningful example:
      a=1;
      iterate( startValue, endValue, step ) =
      if startValue > endValue
      then 0
      else assign( a, startValue ) &
           iterate( startValue + step, endValue, step );
      f(x)=sin(a*x);
      plot(f);
      iterate( 1, 20, .2);
|
| Go to top. |
loadSymbols
| Synopsis: |
loadSymbols( Boolean, String* ); |
| Description: | controls the packages loaded in the symbol table; if the first argument is not 0 loads the specified package in the symbol table, else unloads; the second argument could be a directory relative from the system property FRAIDPATH or name of a class implementing the StaticSymbolsInterface (used in applets). |
| Return Value: |
the number of the successfully loaded/unloaded functions - Complex; |
| Examples: |
loadSymbols(1,"org.fraid.symbtable.StaticSymbols"); //load from a class loadSymbols(True,"bin/org/fraid/graphics/functions"); //load from a directory, note the missing slashes //at the begining and end of the string |
| Go to top. |
False
| Synopsis: |
False; |
| Description: | more readable version of (0+0i) where a Boolean value is expected; |
| Return Value: |
0+0i; |
| Go to top. |
True
| Synopsis: |
True; |
| Description: | a shorthand for 1 where a Boolean is expected; |
| Return Value: |
(1+0i) |
| Go to top. |
debug
| Synopsis: |
debug([Boolean]); |
| Description: | toggles the debug option; if called without arguments returns the current debug state, if called with argument returns the value before the change; |
| Return Value: |
Boolean |
| Go to top. |
debugParser
| Synopsis: |
debugParser(); debugParser(Boolean); |
| Description: | Turns debugging of the parser on or off. Without arguments just prints the current value (0=false,1=true). To prevent excessive outpute turn on for the line(s) of FrAid code you are interested in. |
| Return Value: |
0 (false) or 1 (true) - depending on what the last setting was. |
| Examples: |
debugParser(True);
plot({sin+cos});
debugParser(False);
|
| Go to top. |
exit
| Synopsis: |
exit( [Complex] ); |
| Description: | the real part of the argument is treated as an exit value; closes the current application; |
| Return Value: |
Complex; |
| Go to top. |
info
| Synopsis: |
info; |
| Description: | version and license info; |
| Return Value: |
String; |
| Go to top. |
isComplex
| Synopsis: |
isComplex( Complex ); |
| Description: | checks if the specifeied argument does not evaluate to a String; |
| Return Value: |
Boolean |
| See also: | Types |
| Go to top. |
isFunction
| Synopsis: |
isFunction( Complex ); |
| Description: | checks if the specifid argument is a Function; |
| Return Value: |
Boolean |
| See also: | Types |
| Go to top. |
isString
| Synopsis: |
isString( Complex ); |
| Description: | checks if the specified argument is a String; |
| Return Value: |
Boolean |
| Examples: |
isString(printDef()); // 1 |
| See also: | Types |
| Go to top. |
loadScript
| Synopsis: |
loadScript( fileName ); |
| Description: | Loads a FrAid script from the given file. Returns the value of the last executed command in the script. |
| Return Value: |
Complex |
| Examples: |
loadScript("/home/aaa/myFrAidScript.frd");
|
| Go to top. |
printClassPath
| Synopsis: |
printClassPath(); |
| Description: | Prints the class path after FrAid manipulated it. Use for troubleshooting. |
| Return Value: |
String |
| Go to top. |
printDef
| Synopsis: |
printDef( [Function [, Function,...]] ); |
| Description: | does not return dependancies like printDep but only the definition of the function; returns a string with the definition of a function or with no arguments all functions in the symbol table; this is the former dump function. |
| Return Value: |
String |
| Examples: |
g(x)=x+1; h(x)=x*x*x; f(x,y)=h(x)^g(y)-1; printDef(f); // f( x, y ) = subtract( power( h( x ), g( y ) ), 1.0 ); printDef(sin); /*Java defined function:sin( _0 );*/ |
| Go to top. |
printDep
| Synopsis: |
printDep( [UserDefinedFunction*] ); |
| Description: | returns a string with the specified functions dependancies or all dependancies; if a function f(...) calls (depends on) g(...) and h(...) the complete definition of f(...) should include g(...) and h(...); use this function to save your sessions; this is the former dumpAll function. |
| Return Value: |
String |
| Examples: |
      g(x)=x+1;
      h(x)=x*x*x;
      f(x,y)=h(x)^g(y)-1;
      printDep(f);

Result:
      /*Java defined function:subtract( _0, _1 );*/
      /*Java defined function:power( _0, _1 );*/
      /*Java defined function:add( _0, _1 );*/
      g( x ) = add( x, 1.0 );
      /*Java defined function:multiply( _0, _1 );*/
      h( x ) = multiply( multiply( x, x ), x );
      f( x, y ) = subtract( power( h( x ), g( y ) ), 1.0 );
|
| Go to top. |
printGen
| Synopsis: |
printGen( [Function [, Function,...]] ); |
| Description: | For GeneratedFunction(s) returns a string with the definition of the function(s). For non-generated functions returns an empty string. |
| Return Value: |
String |
| Examples: |
printGen(vector(1,2,3,4)); |
| Go to top. |
printPlugins
| Synopsis: |
printPlugins(); |
| Description: | Prints the plugins visible for FrAid. Use for troubleshooting or to see if you need a certain plugin. |
| Return Value: |
String |
| Go to top. |
printS
| Synopsis: |
printS( SampledFunction ); |
| Description: | Prints the definition of a sampled function. May be unstable when called on very long SampledFunctions. |
| Return Value: |
String |
| Examples: |
printS(vector(1,2,3,4)); |
| Go to top. |
printTree
| Synopsis: |
printTree( UserDefinedFunction* ); |
| Description: | prints the parse tree of the specified user defined function; this is the former dumpTree function |
| Return Value: |
String |
| Examples: |
      g(x)=x+1;
      h(x)=x*x*x;
      f(x,y)=h(x)^g(y)-1;
      printTree(f);

Result:
FunctionCall = subtract( power( h( x0 ), g( x1 ) ), 1.0 ) :ExecutableFunction
 FunctionCall = power( h( x0 ), g( x1 ) ) :ExecutableFunction
  FunctionCall = h( x0 ) :ExecutableFunction
   Variable = x0 :null
  FunctionCall = g( x1 ) :ExecutableFunction
   Variable = x1 :null
 ImaginaryNumber = 1.0 :null
|
| Go to top. |
rename
| Synopsis: |
rename( ComplexFunction, newName ); |
| Description: | Renames the given FrAid variable or function to the new name. Returns the old name. |
| Return Value: |
String |
| Examples: |
a=1; a; rename(a,"bb"); a; // Error bb; // --> 1 |
| Go to top. |
sleep
| Synopsis: |
sleep( Complex ); |
| Description: | sleeps the specified interval in milliseconds |
| Return Value: |
0 |
| Go to top. |
string
| Synopsis: |
string( Arg1, Arg2, ... ); |
| Description: | Returns a string which is the concatenation of the string values of the given arguments. |
| Return Value: |
String |
| Examples: |
myString=string(1," is smaller than ",3); |
| Go to top. |
typeOf
| Synopsis: |
typeOf( Complex ); |
| Description: | returns a string representing the Type of the given argument; |
| Return Value: |
String, three possible values "Complex", "String" and "ComplexFunction" (the UserDefinedFunctions are ComplexFunctions) |
| Examples: |
h(x)=x*x*x;
typeOf(h); //ComplexFunction
typeOf(sin);//ComplexFunction
typeOf(printDef);//String
typeOf("hello");//String
typeOf(2);//Complex
|
| Go to top. |
clear
| Synopsis: |
clear([ UserDefinedFunction*, UserDefinedFunction*, ... ]); |
| Description: | called with no arguments removes all user defined functions from the symbol table;called with a list of arguments removes all functions in the list from the symbol table; |
| Return Value: |
the number of the functions removed - Complex |
| Examples: |
a=5; b=6; f(x,y)=x^y; printDep; clear(a); printDep; clear(); printDep; |
| Go to top. |
closeControllers
| Synopsis: |
closeControllers(); |
| Description: | Closes all open variable controllers. |
| Return Value: |
Complex |
| Examples: |
a=1; b=2; c=3; controlVar(a,b); controlVar(c); closeControllers; //closes all of them |
| Go to top. |
closeWindow
| Synopsis: |
closeWindow( Complex [, Complex, ... ] ); |
| Description: | prints the numbers of variable listeners disconected; closes the specified graphics windows; |
| Return Value: |
the number of successfully closed windows |
| Examples: |
myWindow = plot( sin ); closeWindow( myWindow ); |
| Go to top. |
controlVar
| Synopsis: |
controlVar( UserDefinedVariable* [, UserDefinedVariable*, UserDefinedVariable*, ... ] ); |
| Description: | opens a control window which contains a list of sliders allowing interactive change of the specified variables; pass a list of variables to control interactively. Convenient whith graphics of functions and especially transforms dependant on external variables. |
| Return Value: |
the number of the successfully added to the control window variables - Complex; |
| Examples: |
a=1; b=1; controlVar(a,b); f(x)=(a*sin(b*x)); plot(f); |
| Go to top. |
plotOption
| Synopsis: |
plotOption(windowNumber); plotOption(windowNumber,optionName); plotOption(windowNumber,optionName, newValue); |
| Description: | With no arguments returns a list of all the options(settings) and their types defined for the given window (specified by its window number). With one argument returns the value of the option/setting with the given name. If the option is composite prints the names and types of its members. With two arguments sets the option with the given name to the newValue and returns the old one. For boolean options pass 0 or 1. For string options pass a String. For all numeric options (int, double, etc.) pass a Complex. |
| Return Value: |
Number or String depending on what the option is. |
| Examples: |
sf=10000; f(x)=recordSound(sf); plot(f,0,.01,1,-.01); a=spectrum(f,512); plotOption(a,"threshold",.1); |
| Go to top. |
printWindowFunction
| Synopsis: |
printWindowFunction( Complex [, Complex, ... ] ); |
| Description: | returns a string with the definition of the function(s) being ploted to the specified graphics window; |
| Return Value: |
String |
| Examples: |
h(x)=x*x*x; myWindow = plot(h); printWindowFunction(myWindow); //result -> h( x ) = multiply( multiply( x, x ), x ); |
| Go to top. |
setGridMark
| Synopsis: |
setGridMark( windowNumber, X, Y ); |
| Description: | Sets a new grid mark to the given window at location X:Y. |
| Return Value: |
0 |
| Examples: |
setGridMark(plot(sin),0,0); //open a new plot with the origin marked |
| Go to top. |